Tanmay Ghadge*
Department of Chemical Engineering, Finolex Academy of Management and Technology, Ratnagiri, India
Vrushti Khare
Department of Chemical Engineering, Finolex Academy of Management and Technology, Ratnagiri, India
Shailesh Bhosale
Department of Chemical Engineering, Finolex Academy of Management and Technology, Ratnagiri, India
Prashant A Giri
Assistant Professor, Department of Chemical Engineering, Finolex Academy of Management and Technology, Ratnagiri, India
Vikas Jadhav
Entrepreneur, Satara, India
*Corresponding author: tanmayghadge10@gmail.com
Abstract
Every year, over 400 million MT of plastic are produced around the world, majority of which aren’t managed properly, leading to immeasurable damage to the environment. Only 14-18% as a global average of plastic waste is recycled with only few companies take part in the plastic recycling process. The main goal of the study was to analyse the energy demand and provide a feasible technical solution to conserve energy and reduce the plant's operating costs. A plastic waste recycling station, Amazia Vision Enterprise Private Limited, Satara, India, was purposively chosen to conduct an extensive evaluation of energy requirements. An energy analysis was performed on the process to determine the potential for energy savings and cost reductions. It also aims to reduce the amount of energy used at each stage of the process. Theoretical solutions to conserve energy, reduce waste generation, and thus lower operating costs have been proposed. According to the analysis and subsequent evaluation, the energy requirement can be reduced to 8% of the initial value. A technical solution for recycling of plastics has been proposed which can be implemented to test the feasibility interms of both technical and economical parameters. An energy conservation analysis of a plant has been presented in this paper which will provide a road-map to conserve ever increasing energy consumption and drive more investors in the plastic recycling sector for best plastic waste management practices.
Keywords: Energy conservation, Extrusion, Plastic waste, Recycling, Thermoplastics, Thermostats
DOI: https://doi.org/x
Conflicts of interest: None
Supporting agencies: None
Received 26.02.2022; Revised 17.04.2022; Accepted 02.05.2022
Cite This Article: Ghadge, T., Khare, V., Bhosale, S., Giri, P.A. & Jadhav, V. (2022). Energy Consumption Analysis in the Plastic Waste Recycling Process: A Case Study of Amazia Vision Enterprise Private Limited, Satara, India. Journal of Sustainability and Environmental Management, 1(2), X-X. doi: xxxxxxxx
1. Introduction
Every year, nearly 140 MT of plastics are produced
globally (Business Line, 2020; The Hindu, 2020) A latest review in Western
Europe estimated annual total plastic consumption at 49 MT, or 98 kg per head
of population (Achilias, Roupakias, Megalokonomos, Lappas, & Antonakou,
2007). Outside of the European Union, the United States, China, India, and
Eastern Europe consumed nearly 80% of the global plastics additives. Asia lacks
proper source segregation, recycling and disposal system of waste (Khanal, Giri
& Mainali, 2022). South East Asia, particularly India and China, has
appeared as the world leader in plastics usage, with over 52 MT consumed in
2004. The yearly use of plastics in the United States is expected to be 38.9
MT, closely followed by China's annual consumption of 38.8 MT. With a total
annual consumption of 12.5 MT, India is ranked as the third largest consumer
market for plastics in 2009.
Plastic usage in India has increased dramatically
throughout the 1990s, with an average annual growth rate of 12% (Mutha &
Premnath, 2006). The current pace of growth in India's plastic use is also
expected to be higher than that of China and any other emerging country. India
produced 0.363 MT of plastic polymer in 1990–1991, but within a decade, an
astonishing 890 percent rise led to total plastics output reaching 3.2 MT
(2000–2001). In 2005–2006, India's plastics output increased to 4.77 MT, with
PP and HDPE accounting for the majority (HDPE). On average, commodity plastics
such as PE, PP, PVC, and polystyrene (PS) contribute for 80% of total plastic
usage in India. In India, per capita use of plastics was 0.8 kg in 1990–1991,
and within a decade, per capita consumption increased considerably to 3.5 kg in
2000 (Kaushal, 2012). Plastics in MSW have also expanded dramatically, rising
from 0.7 percent in 1971 to 4 percent in 1995 (NPWMTF, 1997). However, it is
still significantly lower than the world average (18 kg) (Mutha & Premnath,
2006). Nevertheless, as per the National Plastic Waste Management Task Force's
research results (NPWMTF, 1997), packaging accounts for 52% of total plastic
use in India. In India, 1.3 MT of plastic garbage is created annually,
accounting for 36% of total plastics use. In India, over 42 percent of all
produced plastic trash is recycled by 20,000 recycling businesses, with a total
potential of 0.37 MT/year. On other hand, as per the Central Pollution Control
Board's 2019-2020 report, India recycles roughly 60% of its plastic waste
(Tejaswini, Pathak, Ramkrishna, & Ganesh, 2022). According to NPWMTF
(1997), more than 5,400 tonnes of plastic garbage were created in India every
day in 2000–2001.
The current method of removing plastic from street litter
and landfills makes it impossible to recycle 100% of plastic. The rest 40% of
it ends up in landfills, littering streets, water bodies etc., and why does
that happen just because it is disposed of incorrectly(P. Singh & Sharma,
2016; R. K. Singh & Ruj, 2015). 80% of the dry waste generated every day is
plastic, if plastic is managed; rest is not difficult at all. India will be as
clean and beautiful as any developed countries (Gopinath, Nagarajan, Krishnan,
& Malolan, 2020; Ghadge, Khare, Bhosale, Giri, & Jadhav, 2021). Because
of the wide spectrum of recycling and recovery processes, the terminology for
plastics recycling is complicated and often unclear (Banerjee & Srivastava,
2012; Banerjee, Srivastava, & Hung, 2014; Bhattacharya, Chandrasekhar, Roy,
& Khan, 2018; Hussain, Bhattacharya, & Ahmed, 2019). There are four
types of plastic recycling; primary (mechanical reprocessing into a product
with comparable attributes), secondary (mechanical reprocessing into goods with
lesser properties), tertiary (recovery of chemical ingredients), and quaternary
(recovery of chemical constituents) (recovery of energy). Primary recycling is
sometimes referred to as closed-loop recycling, whereas secondary recycling is
referred to as degrading. Tertiary recycling is also known as chemical
recycling or feedstock recycling, and it occurs when a polymer is depolymerized
to its chemical elements (Siddiqui & Pandey, 2013; Sharma & Jain, 2019;
Sharma & Mallubhotla, 2019; Vanapalli, Samal, Dubey, & Bhattacharya,
2019). Energy recoveries, energy from trash, or valorisation are all examples
of quaternary recycling. Composting is also an option for biodegradable
plastics.
In this paper, the energy demand and potential for cost
reduction in an automated plastic recycling plant in Satara, India has been
investigated. A technical solution has been proposed and implemented to test
the feasibility, both technically and economically. An energy conservation
analysis of a plant has been presented that will be able to provide a road-map
to conserve ever increasing energy consumption and drive more investors in the
plastic recycling sector for best plastic waste management practices.
2. Materials and methods
The Amazia Vision Enterprise Private Limited located in
Satara, Maharashtra, India was purposively chosen for this study. The concept
of process tearing and partitioning was implemented in the initial stage of the
study. Flow sheet was divided in suitable number of blocks. Each block was
treated and solved separately. Material and energy balance and operating
conditions of each blocks were evaluated to find the scope for energy conservation
and cost optimization. The data from operating conditions was analyzed to
properly make the choice of the design variable which could be used for further
study.
All process equipment in each block were operated under a
range of conditions; such as quality of plastic waste feed stocks, varying
operating conditions at different production rates. The utilities used in this
industry are mostly electricity and water used to run equipments and washing
purpose. The rating of all electrical motors connected to various equipments as
well as shafts were calculated. The revolutions per minute (rpm) of each and
every impeller or shaft were measured and thus the power consumed by these
equipments were calculated. The rpm of shaft or impeller were optimized at suitable
power requirement. After performing the theoretical energy demand in the
existing process, it was compared with actual demand. By following the
methodology, and disintegrating the process into five parts, energy evaluation
was made easier. The rpm of shafts and impellers were optimized by various
trials conducted on each rotating equipment. This method provided a clear-cut
strategy for selection of process variables, calculation and evaluation of
chemical process and physical parameters.
3. Results and discussion
3.1. About Amazia Vision Enterprise
Private Limited
The company's goal is to recycle plastic and produce
recycled products such as High Density Polyethylene (HDPE) granules,
Polypropylene (PP) granules, Low Density Polyethylene (LDPE) packaging bags, PP
String, etc. (Figure 1). The company produces 600Mt/month HDPE granules,
200Mt/month PP granules, 20Mt/month LDPE packing bags and 40Mt/month PP twine
capacity. The main recycled plastic here is HDPE and PP. The company covers six
acres of land and has an additional two acres of non-agricultural land. The factory
has been built in an area of 1.5 hectares.
The water is supplied to the industry through a well and additional water pipeline directly from the Krishna River. The electricity supplied is 33 kV and can take a load of 3025 kVA. The factory has warehouses in Pune, Kolhapur, Shirwal and Satara. Most of the recycled scrap is picked up at these locations.
.bmp)
There are five large machines that work continuously throughout the recycling process. It includes a 2-stage cascade extrusion line of 180mm with die head cutter from RR Plastic with a capacity of 1Mt/h, a 120mm venting extruder, a 140mm mother-baby extruder, a fully automatic washing line with a capacity of 1.5 MT from Bhavya Machinery, Umargaon brand and a color sorting machine with a capacity of 1 MT from Venus Color Sorting, Coimbatore. They also have a wastewater treatment plant (ETP) with a capacity of 1100 liters/day. The company employs around 400 experienced employees. Table 1 shows the amount of plastic processed at the factory per day
Plastic
recycling process
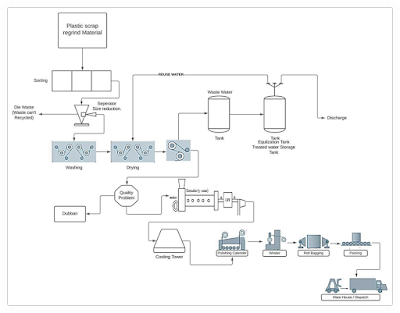
Once the plastic
regrind material is collected from various warehouses, it is first sorted (2
days) as per the plastic quality and further sent to the size reduction (1 day)
process. The materials that are left out after size reduction is the die waste.
Once the final plastic is collected, it is thoroughly washed, dried and goes
through a complete quality check (4 days). The waste water after washing (dirty
water) is to be treated in ETP and then it is discharged. Now, after washing,
the plastic is sent to a compounding and extrusion machine wherein it is
completely crushed, melted and takes 4 days to finish. The next process taking
place in the extrusion is the dehumidification and polishing (2 days) wherein
the plastic is granulated into die face cut and is polished to give a final
product. The final product then goes through a quality check and later to the
bagging (1 day). All the recycled plastic that passes the quality check is
bagged and is dispatched (1 day) to the warehouse for further distribution to
various companies. The by-product or the waste (Dubban) that is generated is
further used for manufacturing PP twine and for Pyrolysis (Saxena &
Srivastava, 2022). This process takes 15 days to complete (Figure 1).
Types of
plastic waste collected
Two different types of plastic wastes are collected
Recyclable Plastics
(Thermoplastics): PET, HDPE, LDPE, PP, PVC, PS, etc.
Non-Recyclable Plastics (Thermoset & others): Multilayer & Laminated Plastics, PUF, Bakelite, Polycarbonate, Nylon, etc. There are seven categories of plastics, like PET, HDPE, PVC, LDPE, PP, PS and other. The typical thermoplastic and thermosetting resins are shown in Table 3.
.bmp)
3.2. Discussion
The methods of
tearing and partitioning lead us to study the process better when implemented (Smith,
1995; Biegler, Grossmann, & Westerberg, 1997). Dividing the process flow
sheet into several parts or number of blocks give a more efficient data to work
on, considering the partitioning created needs to be treated and solved
separately. The operating conditions data and mechanical design of the
equipment must be analyzed properly to make the choice of the design variable
used for the study. It is necessary that each part of the process is operated
under a range of conditions, such as quality of waste feed stocks, varying
operating conditions, and different production rates (Satapathy, 2017; Letcher,
2020; Ncube, Ude, Ogunmuyiwa, Zulkifli, & Beas, 2021). Since all the
equipment’s involved and operating are electrical utilities and the rest is
water for washing purpose, it is found out to be having a different rating for
all electrical motors connected as well as shafts. Further, the RPM of each
shaft and equipment was measured and, using specific equations and methods, the
energy consumed was calculated. The date for the energy consumed by each
machine and the factors involved has been presented in Table 4. Similarly, the
RPM data was also calculated, considering the power utilized and originally
required. The RPM data has been presented in Table 5.
The Table 4
shows the energy consumed by every machine that is involved in the process; the
data is represented on a kWh/day and kWh/month basis. Considering the total HP
of every machine, initially, the power was calculated and then the total energy
consumed.
According to the
methods and equations used, the data accumulated was more than expected.
Considering the aim, the cost of the total recycling process needs to be
optimized and, less consumption of electricity is necessary. If the optimum
conditions selected, the process for the design is not certainly the most
optimum, resulting it being inefficient. It is a job to understand the process
and identify the issue and make changes that are efficient after creating
optimum conditions. This will only be possible by studying and analysing each
partitioned block deep enough, making sure that change does not affect the
efficiency. By working towards the aim and never losing sight of the goal to
optimize, the cost and maximizing the profit of a business is crucial.
Hopefully, this discussion will provide a logical method for selection of
process variables, calculations and evolution of chemical process optimization.
It is also recommended to carry out the rigorous analysis of all manipulated design
variables to arrive at the optimal cost, which comprises capital and the
operational cost.
The decrease in energy need was determined by following the approach from the previous section. Table 6 illustrates the actual energy consumption in a plant each month and the reduction in energy demand after applying the trial in plant based on recommendations in methodology. One ton of recycled plastic, in theory, saves 5,774 Kwh of energy, 16.3 barrels of oil, 98 million BTUs of energy, and 30 cubic yards of landfill space. Table 6 shows that there was 8% decrease in energy usage for the same process but with optimized parameters. It is recommended to carry out detailed evaluation of dominant physical parameters like revolutions per minute and power factor at each stage of the process.
.bmp)
.bmp)
The current work
identified that there is great potential for energy conservation in Amazia
Vision Enterprise Private Limited, Satara. It was found that there is potential
of immediate reduction of energy requirements by 8% of the actual value. It is
recommended that optimization can be performed for various process parameters
at each stage of the process. In order to meet the targets for energy savings
and cost optimization, a detailed study of economics over the process is also
recommended.
Acknowledgements
The authors like
to express special thanks to the representatives of Amazia Vision Enterprise
Pvt. Ltd. for giving the opportunity to carry out the field work. Also special
thanks to the owners of the plastic recycling firm and the entire team who
permitted and supported to collect data and understand the process in detail.
References
Achilias, D. S., Roupakias,
C., Megalokonomos, P., Lappas, A. A., & Antonakou, Ε. V. (2007). Chemical
recycling of plastic wastes made from polyethylene (LDPE and HDPE) and
polypropylene (PP). Journal of Hazardous
Materials, 149(3), 536-542.
Banerjee, T., &
Srivastava, R. K. (2012). Plastics waste management and resource recovery in
India. International Journal of
Environment and Waste Management, 10(1), 90-111.
Banerjee, T., Srivastava,
R. K., & Hung, Y.-T. (2014). Plastics
waste management in India: an integrated solid waste management approach. Handbook
of Environment and Waste Management: Land and Groundwater Pollution Control,
1029-1060.
Bhattacharya, R.,
Chandrasekhar, K., Roy, P., & Khan, A. (2018). Challenges and opportunities: plastic waste management in India.
Biegler, L. T., Grossmann,
I. E., & Westerberg, A. W. (1997). Systematic
methods for chemical process design.
Ghadge, T., Khare, V.,
Bhosale, S., Giri, P. A., & Jadhav, V. (2021) A case study on energy
conservation and cost optimization at Amazia Vision Environment Private
Limited, Satara. World Wide Journal of
Multidisciplinary Research and Development, 7(10), 41-44.
Gopinath, K. P., Nagarajan,
V. M., Krishnan, A., & Malolan, R. (2020). A critical review on the
influence of energy, environmental and economic factors on various processes
used to handle and recycle plastic wastes: Development of a comprehensive index. Journal of Cleaner Production, 274,
123031.
Hussain, A., Bhattacharya,
A., & Ahmed, A. (2019). Plastic waste pollution and its management in
India: a review. Advanced Treatment
Techniques for Industrial Wastewater, 62-73.
Kaushal, R. K., Varghese,
G. K., & Chabukdhara, M. (2012). Municipal solid waste management in
India-current state and future challenges: a review. International Journal of Engineering Science and Technology, 4(4),
1473-1489.
Khanal, A., Giri, S., &
Mainali, P. (2022). Practices of source segregation of household solid waste by
youths of Nepal. Heliyon. Available
at SSRN 4020939.
Letcher, T. M. (2020). Plastic waste and recycling: environmental
impact, societal issues, prevention, and solutions. Academic Press.
Mutha, N. H., Patel, M.,
& Premnath, V. (2006). Plastics materials flow analysis for India. Resources, Conservation and Recycling, 47(3),
222-244.
Ncube, L. K., Ude, A. U.,
Ogunmuyiwa, E. N., Zulkifli, R., & Beas, I. N. (2021). An overview of
plastic waste generation and management in food packaging industries. Recycling, 6(1), 12.
Satapathy, S. (2017). An
analysis of barriers for plastic recycling in the Indian plastic industry. Benchmarking: An International Journal.
Saxena, A., &
Srivastava, A. (2022). Industry application of green manufacturing: A critical
review. Journal of Sustainability and
Environmental Management, 1(1), 32-45.
Sharma, K. D., & Jain,
S. (2019). Overview of municipal solid waste generation, composition, and
management in India. Journal of
Environmental Engineering, 145(3), 04018143.
Sharma, S., &
Mallubhotla, S. (2019). Plastic waste
management practices. Zero Waste: Management Practices for Environmental
Sustainability.
Siddiqui, J., & Pandey,
G. (2013). A review of plastic waste management strategies. International Research Journal of Environment
Science, 2(12), 84-88.
Singh, P., & Sharma, V.
(2016). Integrated plastic waste management: environmental and improved health
approaches. Procedia Environmental
Sciences, 35, 692-700.
Singh, R. K., & Ruj, B.
(2015). Plasticwaste management and disposal techniques-Indian scenario.
International Journal of Plastics
Technology, 19(2), 211-226.
Smith, R. (1995). Chemical process design and integration.
Hoboken, New Jersey: John Wiley & Sons.
Tejaswini, M., Pathak, P.,
Ramkrishna, S., & Ganesh, S. P. (2022). A comprehensive review on
integrative approach for sustainable management of plastic waste and its
associated externalities. Science of The
Total Environment, 153973.
Vanapalli, K. R., Samal, B., Dubey, B. K., & Bhattacharya, J. (2019). Emissions and environmental burdens associated with plastic solid waste management. Plastics to Energy, 313-342.
|
|
©
The Author(s)
2022. This article is an open access article distributed under the terms and conditions
of the Creative Commons Attribution (CC BY) license. |
